NVEIL Toolkit
Data science made easy.
From raw data to processed insights and production visuals — just describe what you need.
Two Engines, One Toolkit
Most tools do one thing. NVEIL handles both halves of the data science workflow:
-
Data Processing Engine
Describe your data pipeline in plain language. NVEIL plans and executes it locally: joins, aggregations, pivots, time series analysis, geocoding, feature engineering, and more. No pandas code to write, no pipeline to maintain.
-
Visualization Engine
NVEIL generates production code for Apache ECharts, VTK, DeckGL, and more so you don't have to write a single line of chart configuration. 50+ visualization types, each handcrafted to get the most out of these libraries.
You describe the goal, NVEIL handles the rest
"Compare revenue vs targets by region" produces a join across DataFrames, an aggregation by region, and a grouped bar chart. One line of code.
Quick Example
import nveil
import pandas as pd

nveil.configure(api_key="nveil_...")

df = pd.read_csv("sales.csv")

# NVEIL processes your data AND generates the visualization
spec = nveil.generate_spec("Revenue by region, colored by quarter", df)

fig = spec.render(df)       # 100% local, no API call
nveil.show(fig)              # opens in browser
nveil.save_image(fig, "chart.png")
From your shell
The same nveil binary works from the terminal — no Python script required.
export NVEIL_API_KEY=nveil_...

# Ground yourself on the dataset (shape / dtypes / head preview)
nveil describe sales.csv

# Generate HTML + PNG + a reusable .nveil spec
nveil generate "Revenue by region, colored by quarter" \
  --data sales.csv --output revenue.[all] --explain

# Re-render a saved spec on fresh data (no API call)
nveil render chart.nveil --data new_sales.csv
It also installs a skill and an MCP server for AI agents (Claude Code, Claude Desktop, Cursor, Codex, …). See CLI & AI Agents.
How It Works
graph LR
    A[Your Data] --> B[Toolkit]
    B -- metadata only --> C[NVEIL AI]
    C -- processing plan --> B
    B -- runs locally --> D[Result]

    style A fill:#1a1a2e,stroke:#f7941d,color:#fff
    style B fill:#5c2d91,stroke:#e91e8c,color:#fff
    style C fill:#e91e8c,stroke:#f7941d,color:#fff
    style D fill:#1a1a2e,stroke:#f7941d,color:#fff
The Toolkit sends only metadata (column names, types, statistics) to the server. Your raw data stays on your machine. The AI plans the processing and visualization, then the Toolkit executes everything locally.
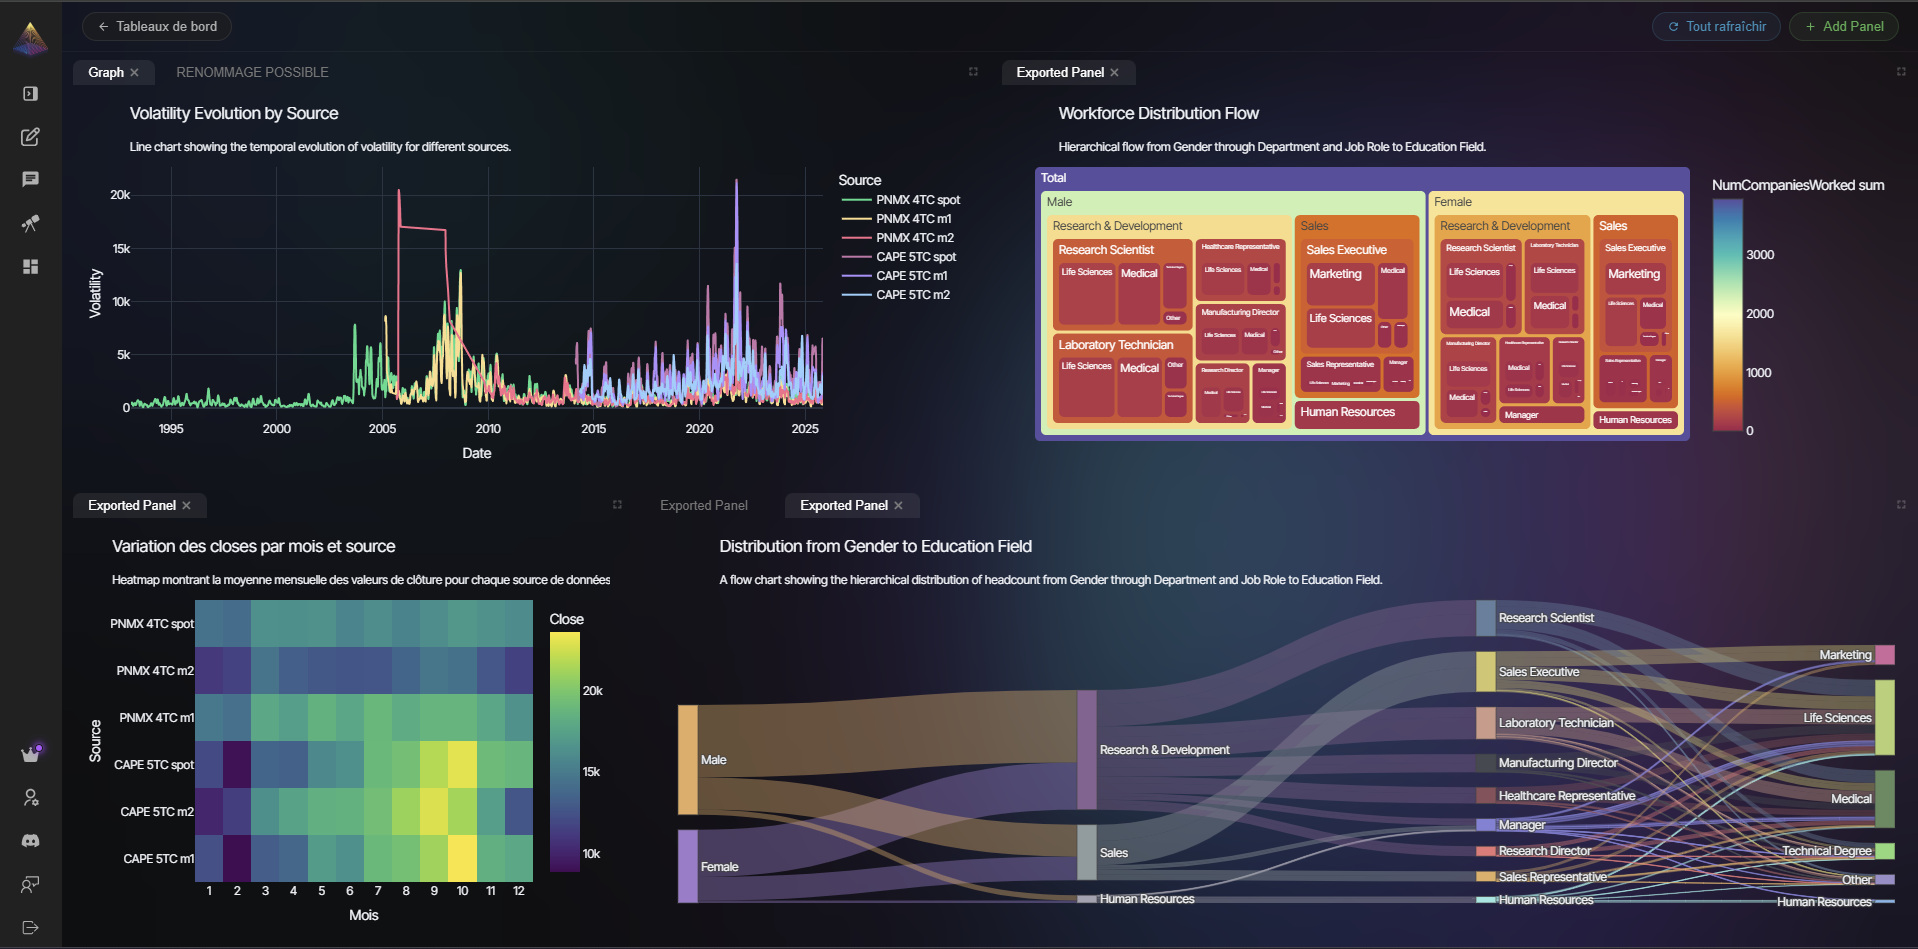
Beyond Simple Charts
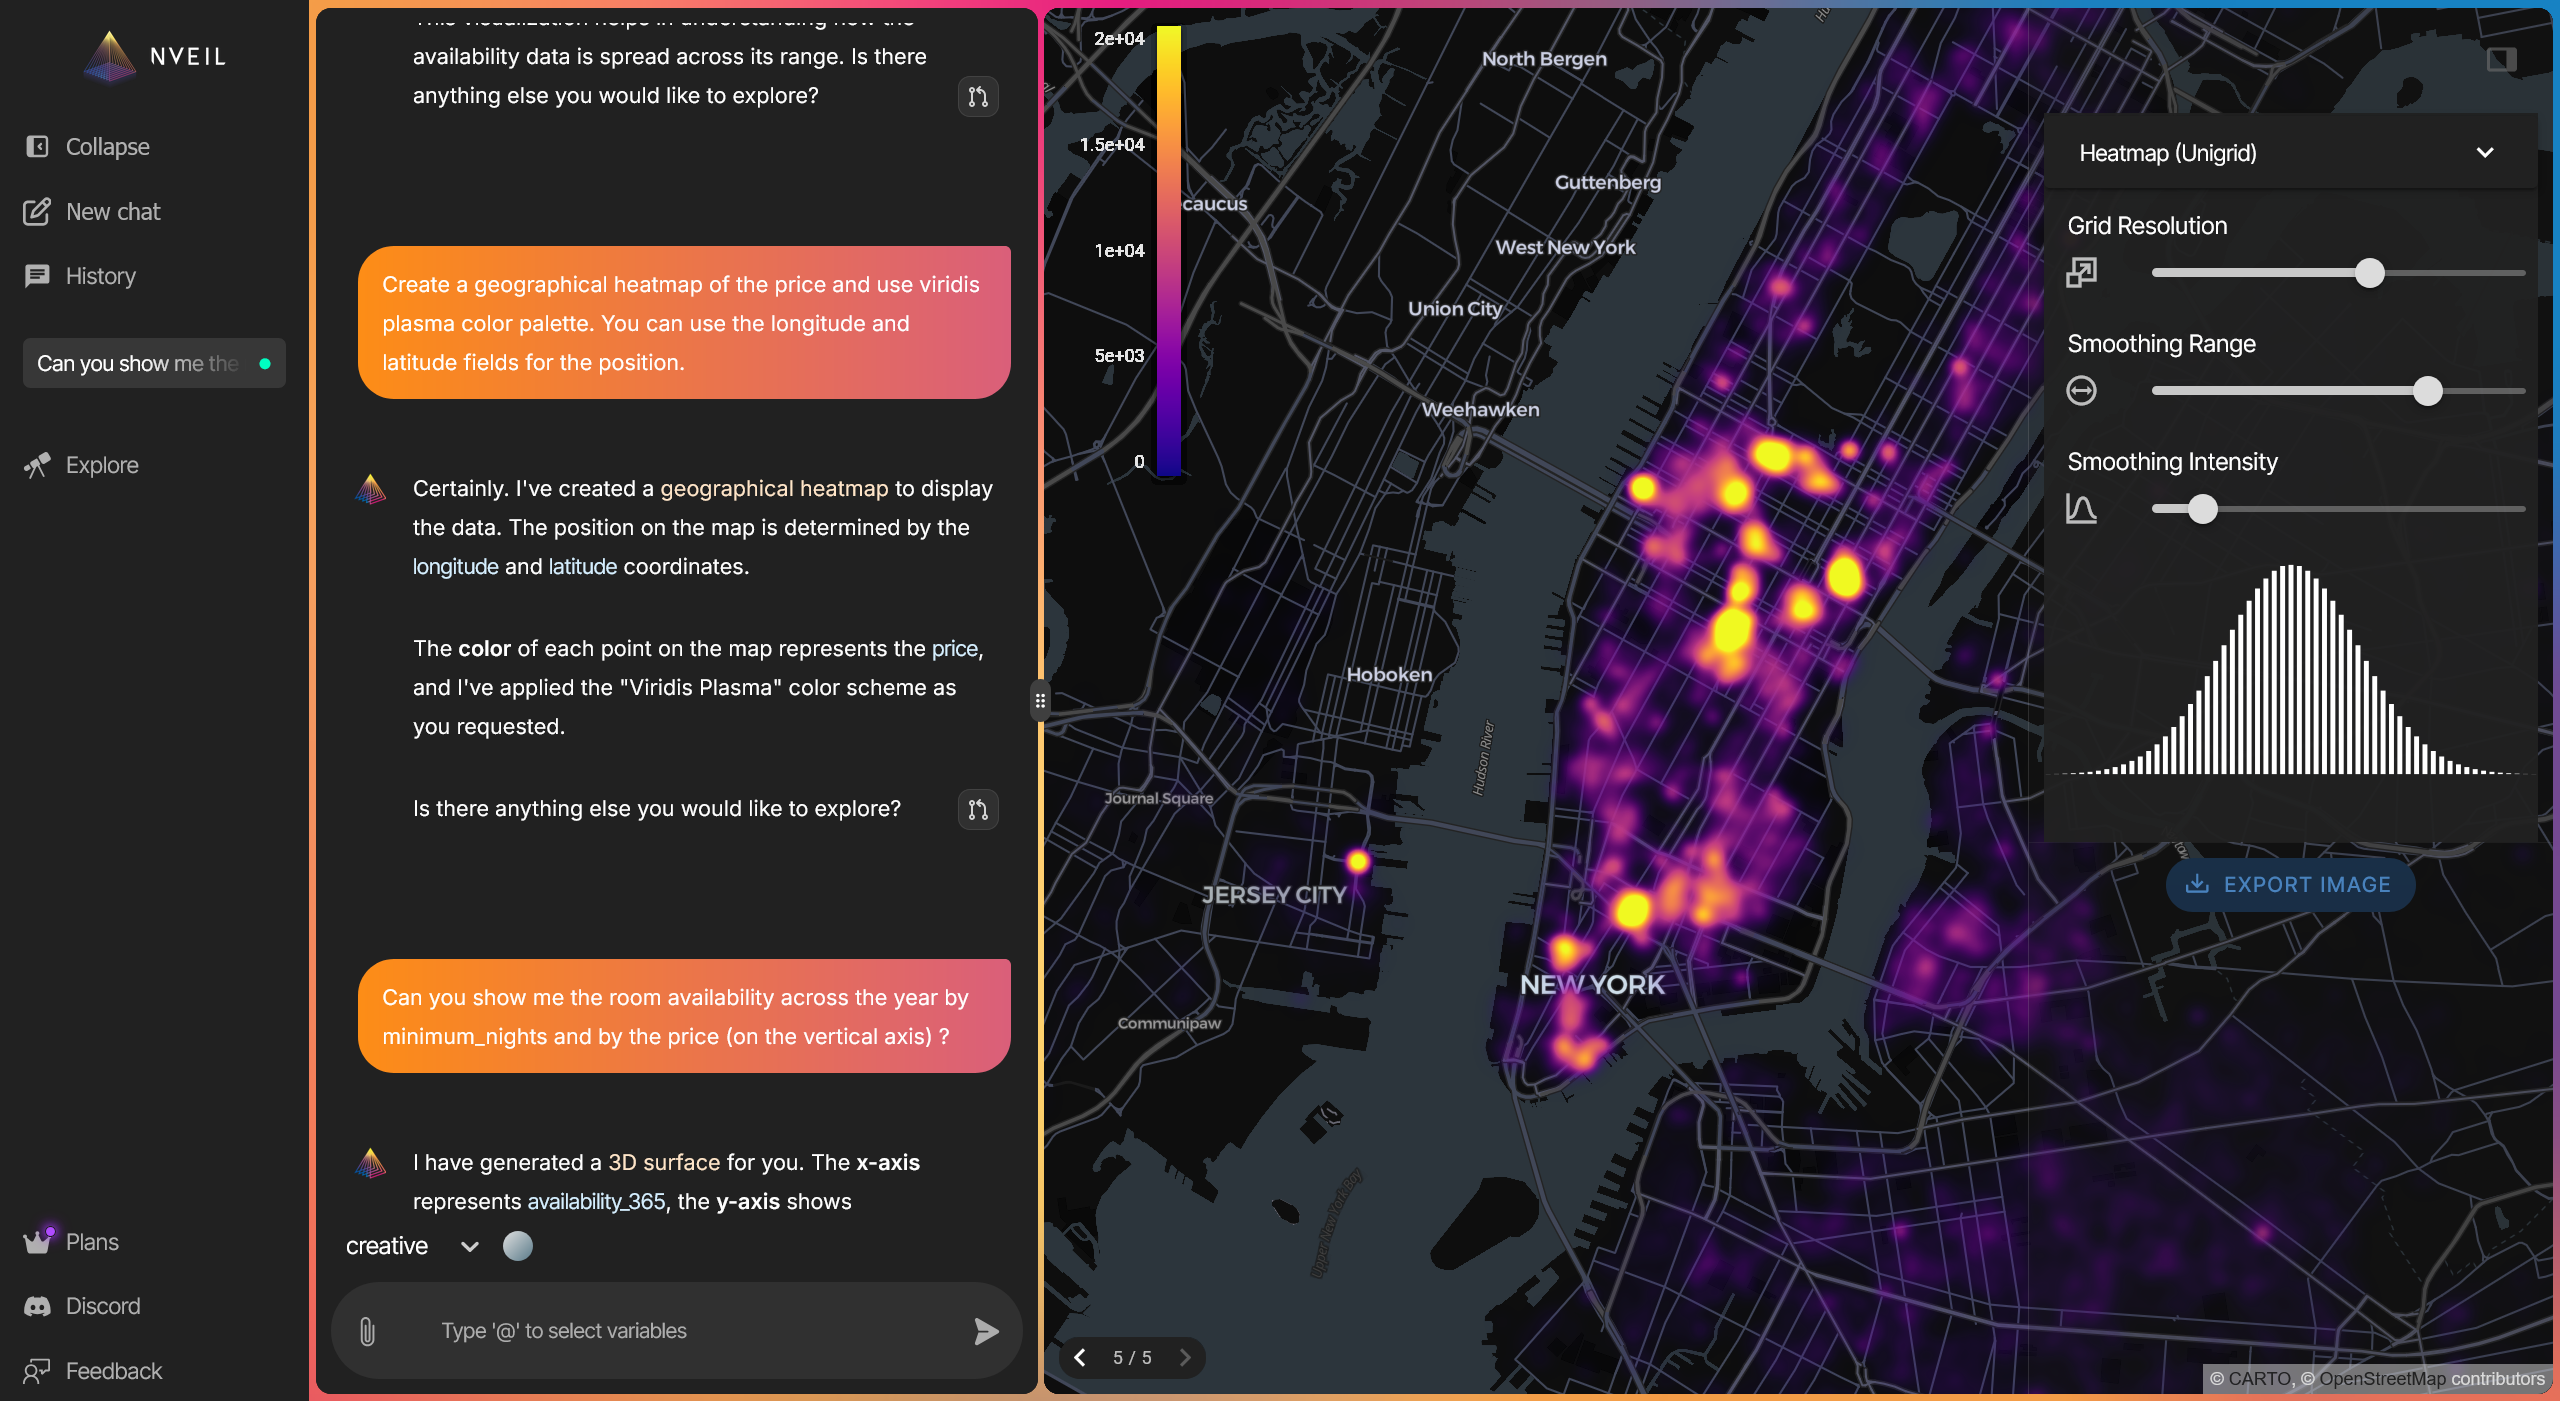
-
Geospatial
Heatmaps, choropleths, and point clouds on interactive maps. Automatic geocoding from city names or coordinates.
-
3D & Scientific
Surfaces, volumes, point clouds, and meshes. Medical imaging (DICOM), biosignal data (EDF/EDF+), scientific data, and engineering models.
-
Time Series
Trends, forecasting, rolling statistics, seasonal decomposition. Automatic date parsing and resampling.
-
Auditable Results
Every output is deterministic, backed by constraint solving instead of random generation. Same input, same result, every time.
Save, Reload, Render Anywhere
# Generate once (API call)
spec = nveil.generate_spec("Monthly trend by category", df)
spec.save("trend.nveil")

# Reload later — no API call, no server needed
spec = nveil.load_spec("trend.nveil")
fig = spec.render(fresh_data)  # new data, same pipeline + visualization
nveil.save_image(fig, "report.png")
.nveil files are encrypted and portable. Share them with colleagues, use them in CI/CD pipelines, or embed in automated reports.
-
Get Started
Install the Toolkit and create your first visualization in minutes.
-
Concepts
Understand sessions, specs, and the processing pipeline.
-
API Reference
Full reference for all public functions and classes.
-
Examples
Recipes for charts, multi-dataset processing, and offline rendering.
-
CLI & AI Agents
Use NVEIL from the shell, or install it as a skill / MCP server for Claude, Cursor, Codex, and more.